 Wednesday, April 30, 2025 -
GGIR updates
GGIR release 3.2-6
Wednesday, April 30, 2025 -
GGIR updates
GGIR release 3.2-6
Wednesday, March 3, 2021
Chronic fatigue is a condition where patients perceive extreme fatigue for long periods of time. Mental activity or physical activity worsen the fatigue, while paradoxically taking rest is not always a solution. The Dutch Expert Center for Chronic Fatigue explores how patients with Chronic fatigue can best be supported. The issue of chronic fatigue is especially timely now many Covid-19 patients also experience chronic fatigue during their recovery, which is the focus of the Centre’s new ReCOVer study. If you are living in The Netherlands and have had Covid-19, please check out the study’s participant recruitment website.
Physical behaviour assessment
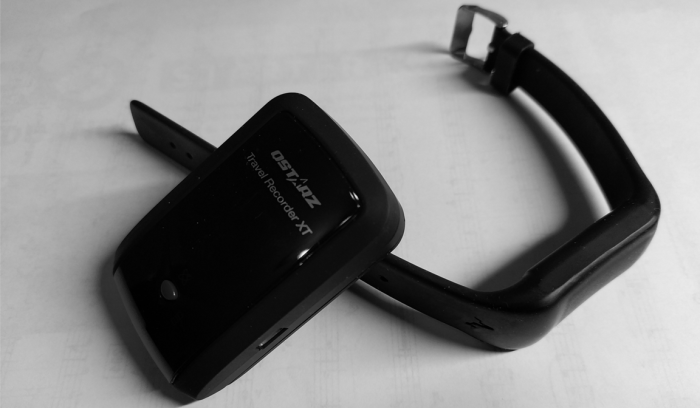
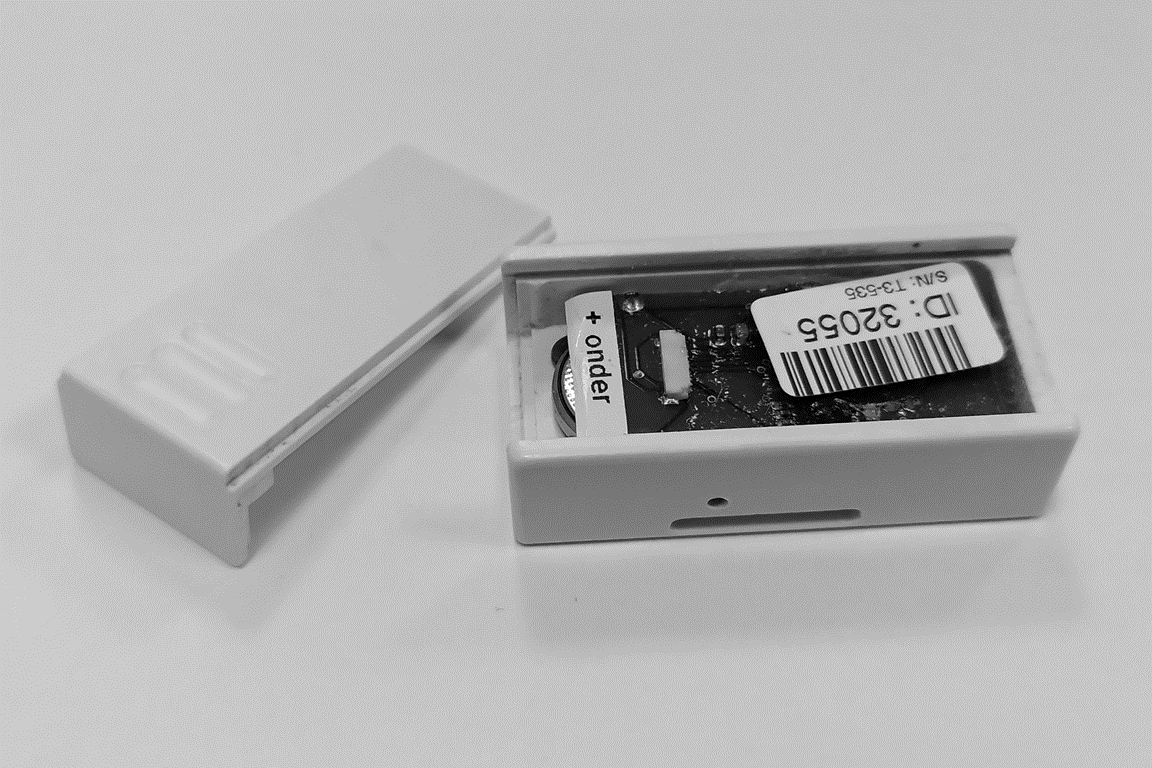
A good understanding of fatigue requires insight in a patient’s lifestyle in terms of physical behaviour. To quantify physical behaviour the Expert Center has used an ankle worn accelerometer, named Actometer, since 1997 (see image). In short, the Actometer and the accompanying software classifies an individual into one of three classes: Pervasively passive, fluctuating active, and pervasively active. Clinicians use these classifications together with other information about the patient to inform a treatment program. Unfortunately, the manufacturing of Actometers has stopped. Therefore, a transition to modern accelerometers is needed. Although, it would be great if we can somehow preserve the informative value of the Actometer software output that the clinicians are familiar with and that is supported by literature.
Can we replicate the old technology?
Around the year 2014 I already explored whether Actometer output can be mimicked with modern accelerometer data. For this I relied on the descriptions provided in the original publications by Vercoulen et al 1997 and van der Werf et al. 2000. Unfortunately, an accurate replication proved to be difficult at the time, possibly explained by unknown differences in hardware properties between old and new sensors and the software not being open source.
In 2019, Prof. Dr. Hans Knoop from the Dutch Center for Chronic Fatigue asked me to pick up the work again. However, this time with an additional question: Can we replicate ankle-worn Actometer output based on a wrist-worn accelerometer? Wrist-attachment opens the door for better comparability with many modern studies, especially for sleep assessment. In this blog post I am providing an overview of the work I have done to help the Dutch Center for Chronic Fatigue with this.
Classification model
Given the known challenges with replicating Actometer counts and 1990s sensor output in general, I decided to go for a simple interpretable indicator of body movement. The indicator roughly reflects the Actometer approach as it applies a band-pass filter to the three acceleration signals. Here, I use the same filter settings as described for the Actometer. Next, I calculate the average vector magnitude during waking hours per day. To identify waking hours, I use the sleep detection algorithm I previously developed for UK Biobank, aided by sleep diary (if available) as I described in a separate study. After this I calculate the 91.66th percentile of the distribution of this variable across the days. Here, the 91.66th percentile matches the required 11 out of 12 days of inactivity in the original Actometer algorithm described by van der Werf. Finally, I use the resulting acceleration value to classify a person as pervasively passive with logistic regression. Note that I merge the classes ‘fluctuating active’ and ‘pervasively active’ in one active class as discriminating those was considered less relevant.
Training the model
The logistic regression model was trained with a dataset where patients wore simultaneously one Actometer on the ankle and one accelerometer (ActiGraph) on the wrist. The performance of the classification model was assessed with leave-one-out cross validation. Given that there are no hyper parameters to optimize and given the moderate sample size (N=50), I decided not to create an additional independent test set. However, when more data is available later this year we could use that to improve the model or as independent test set.
Reflections on model performance
The model currently classifies 42 out of the 50 individuals correctly, 6 active individuals are misclassified as pervasively passive, and 2 pervasively passive individuals are misclassified as active. However, the model’s classification of behaviour appears consistent with what we see in the data. Patients classified as active truly move a lot and patients classified as pervasively passive truly move very little. One plausible explanation for the misclassified patients is the difference in sensor placement. For example, it is not hard to imagine that an ankle worn sensor picks up cycling better than a wrist-worn sensor. On the other hand, an ankle sensor will miss the arm movements when sitting down. We did not encounter any major issues with the quality of the data.
Clinical research implementation
Aside from developing a classification model I worked on its implementation in the clinical research setting. The intended users are research nurses and psychologists who have limited time to be involved in the data handling and are not computer savvy.
In a previous project, named Optimistic, this was addressed with a cloud service, but in the current project I decided to initially work on a local offline solution. This allowed me to focus on the model development first. The development of a cloud service could of course be a future enhancement to facilitate scaling it up.
Software design
I used R package GGIR to pre-process the accelerometer data. Therefore, I also developed the rest of the data analysis in the R programming language and organized it as a complementary open-source R package. For now, the code is in a pragmatic location, with a temporary name, and with limited documentation. I am aiming to improve those aspects later this year.
Software interface
Before using the model for the first time, the user (research nurse/psychologist) will have to install R and RStudio on their laptop. Next, the user must download a specific R script, open it in RStudio, and press the Source button in RStudio. This will trigger the installation of all relevant software dependencies.
Initially I explored RShiny as a more attractive user interface. However, I decided to not pursue this yet as the added software complexity worried me. Complex software is harder to maintain and more bug prone, and also I wanted to prioritize my time towards the model itself.
After the installation, the software asks the user to specify the input and output directories and then the data processing automatically starts.
Software output and speed
At the end of the process the software creates a pdf-report. The pdf-report shows the classification of the patient as pervasively passive or active, a Z-score of the average acceleration relative to a reference population, a visual overview of the day-by-day physical behaviour level, sleep characteristics, and accelerometer wear time. The software completes a 14-day accelerometer recording within 10 minutes on a standard laptop.
Do you want the same for your study?
Recently the ReCOVer study started to use the solution that I am describing in this blog post. If you have feedback, want to know more, or would like to hire me to work on similar wearable data challenges then let me know!
More articles
Wednesday, April 30, 2025 -
GGIR updates
GGIR release 3.2-6